
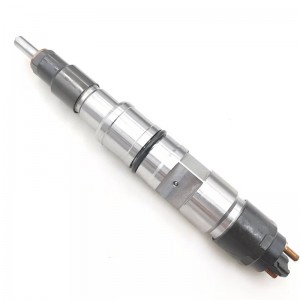
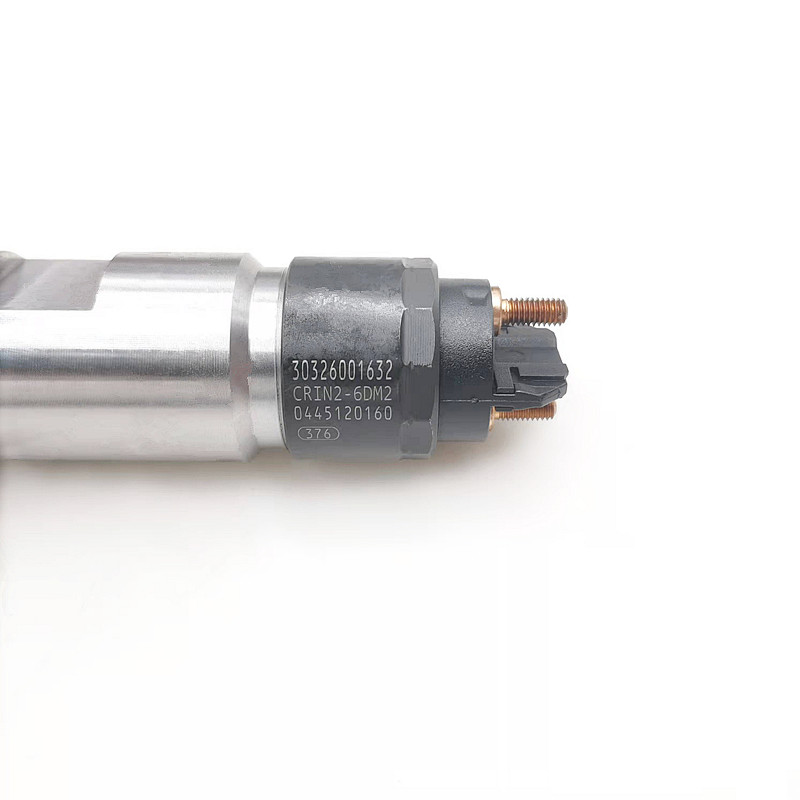
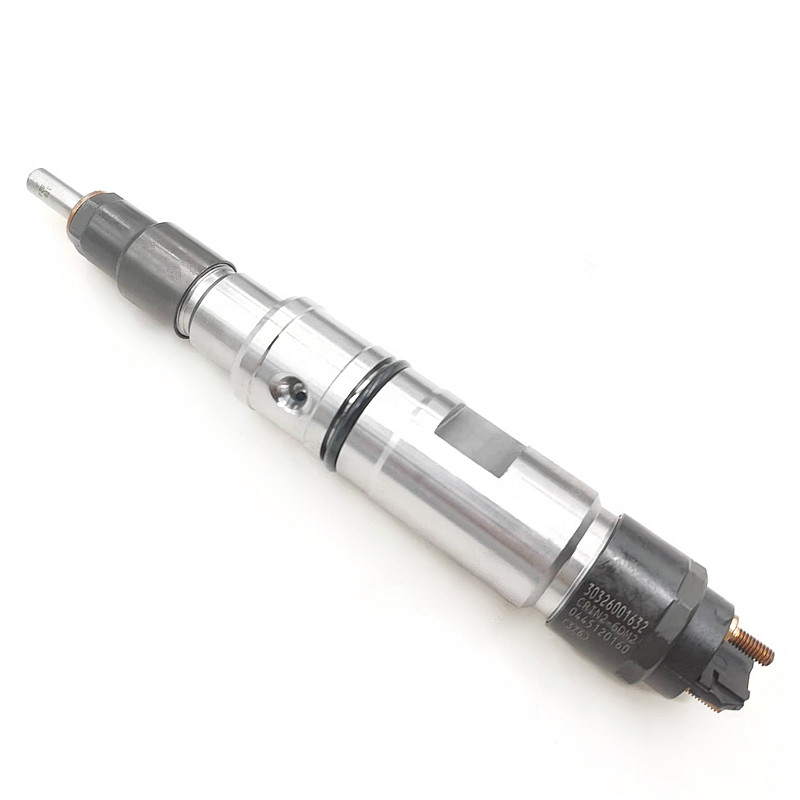
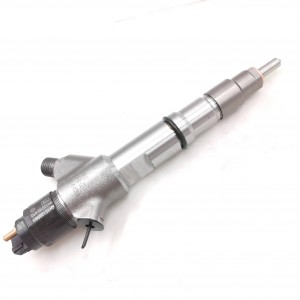
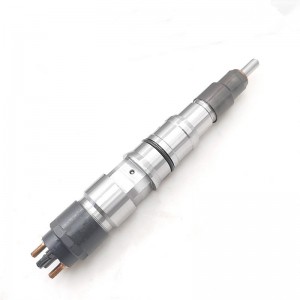
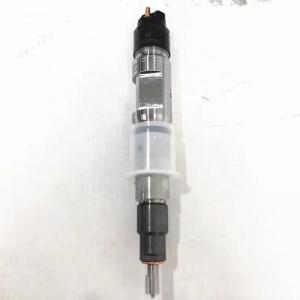
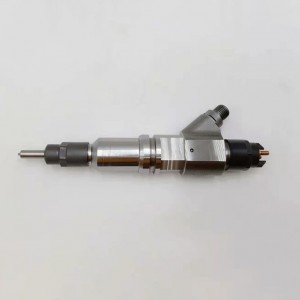
Diesel Injector Fuel Injector 0445120160 Bosch for Yc6m/Mk 9.8 Engine


products detail
Used in Vehicles / Engines
| Product Code | 0445120160 |
| Engine Model | / |
| Application | Gaz Deutz Yamz Engine |
| MOQ | 6 pcs / Negotiated |
| Packaging | White Box Packaging or Customer's Requirement |
| Warranty | 6 months |
| Lead time | 7-15 working days after confirm order |
| Payment | T/T, PAYPAL, as your preference |
| Delivery Method | DHL, TNT, UPS, FedEx, EMS or Requested |
Our advantage
Developing the Model of Fuel Injection Process Efficiency Analysis for Injector for Diesel Engines (part 6)
where rT and rb – are density of fuel and air respectively mT and mb – fuel and air dynamic viscosity; σ –fuel surface tension; c d - nozzle orifice diameter. Therefore, the formula takes the form (5):
Based on the selected method, a model was simulated in the LMS Imagine.Lab AMESim software package with the diagram represented in figure 4. Figure 4. Calculation block of the Sauter mean drop diameter in LMS Imagine.Lab AMESim.
Also during the injection process, it is important to aim at the formation of small fuel drops with simultaneously ensuring the ability of drops to penetrate deeply in all directions in the compressed air medium in the combustion chamber.
Penetration of drops into the compressed air medium depends on the range of the fuel jet. With the reduced range of the jet, the fuel drops may not penetrate into the remotest parts of the combustion chamber, incomplete combustion occurs, the specific fuel consumption increases, the engine power decreases.
The range of the spray from the nozzle orifie may be determined from expression (7):
dC - Nozzle orifice diameter, m; JD – actual fuel discharge rate m/s; t – time of spray movement from the injector s; We – Weber criterion; Mx - Mach criterion (ratio of the fluid flow rate to the sound velocity; rk - density criterion (ration of the air density to the fuel density). This method for determining the spray range was also modeled in the LMS Imagine.Lab AMESim software package, whose flowchart is given in fig. 5
Products categories
-
Diesel Injector Fuel Injector 0445120081 Bosch ...
-

Diesel Injector Fuel Injector 0445120256 Bosch ...
-
Diesel Injector Fuel Injector 0445120110 Bosch ...
-
Diesel Fuel Injector 0445120353 Common Rail Inj...
-
Diesel Injector Fuel Injector 0445120157 Bosch ...
-
Common Rail Fuel Injection Pump Parts Fuel Inje...


